Dear friends,
Over the last two weeks, I described the importance of clean, consistent labels and how to use human-level performance (HLP) to trigger a review of whether labeling instructions need to be reviewed.
When training examples are labeled inconsistently, an AI that beats HLP on the test set might not actually perform better than humans in practice. Take speech recognition. If humans transcribing an audio clip were to label the same speech disfluency “um” (a U.S. version) 70 percent of the time and “erm” (a UK variation) 30 percent of the time, then HLP would be low. Two randomly chosen labelers would agree only 58 percent of the time (0.72 + 0.33). An AI model could gain a statistical advantage by picking “um” all of the time, which would be consistent with 70 percent of the time with the human-supplied label. Thus, the AI would beat HLP without being more accurate in a way that matters.
Labeling training data consistently is particularly important for small data problems. Innovations like data synthesis using generative adversarial networks, data augmentation, transfer learning, and self-supervision expand the possibilities for small data. But when I’m trying to train a neural network on 1,000 examples, the first thing I do is make sure they’re labeled consistently.
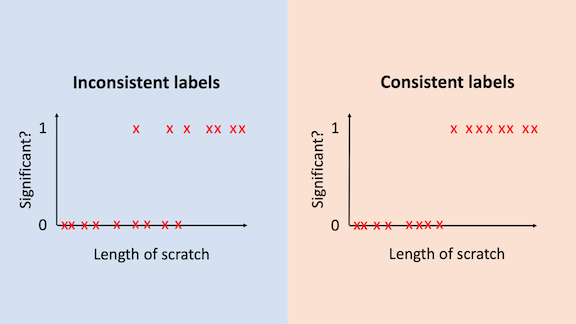
Let’s continue with last week’s example of determining if a scratch is significant based on its length. If the labels are noisy — say, different labelers used different thresholds for labeling a scratch as significant (the left-hand graph in the image above)¸— an algorithm will need a large number of examples to determine the optimal threshold. But if the data were clean — if all the labelers agree on the length that causes the label to switch from 0 to 1 (the right-hand graph) — the optimal threshold is clear.
Learning theory affirms that the number of examples needed is significantly lower when the data is consistently labeled. In the simple example above, the error decreases on the order of {1 / √ m} in the case on the left, and {1/m} in the case on the right, where m is the training set size. Thus, error decreases much faster when the labels are consistent, and the algorithm needs many fewer examples to do well.
Clean labels are generally helpful. You might be better able to get away with noisy labels when you have 1 million examples, since the algorithm can average over them. And it’s certainly much harder to revise 1 million labels than 1,000. But clean labels are worthwhile for all machine learning problems and particularly important if you’re working with small data.
Keep learning!
Andrew
News
Washington Wrestles with AI
The U.S. government’s effort to take advantage of AI have not lived up to its promise, according to a new report.
What’s new: Implementations of machine learning systems by federal agencies are “uneven at best, and problematic and perhaps dangerous at worst,” said authors of a survey by the Administrative Conference of the United States, Stanford Law School, and New York University School of Law.
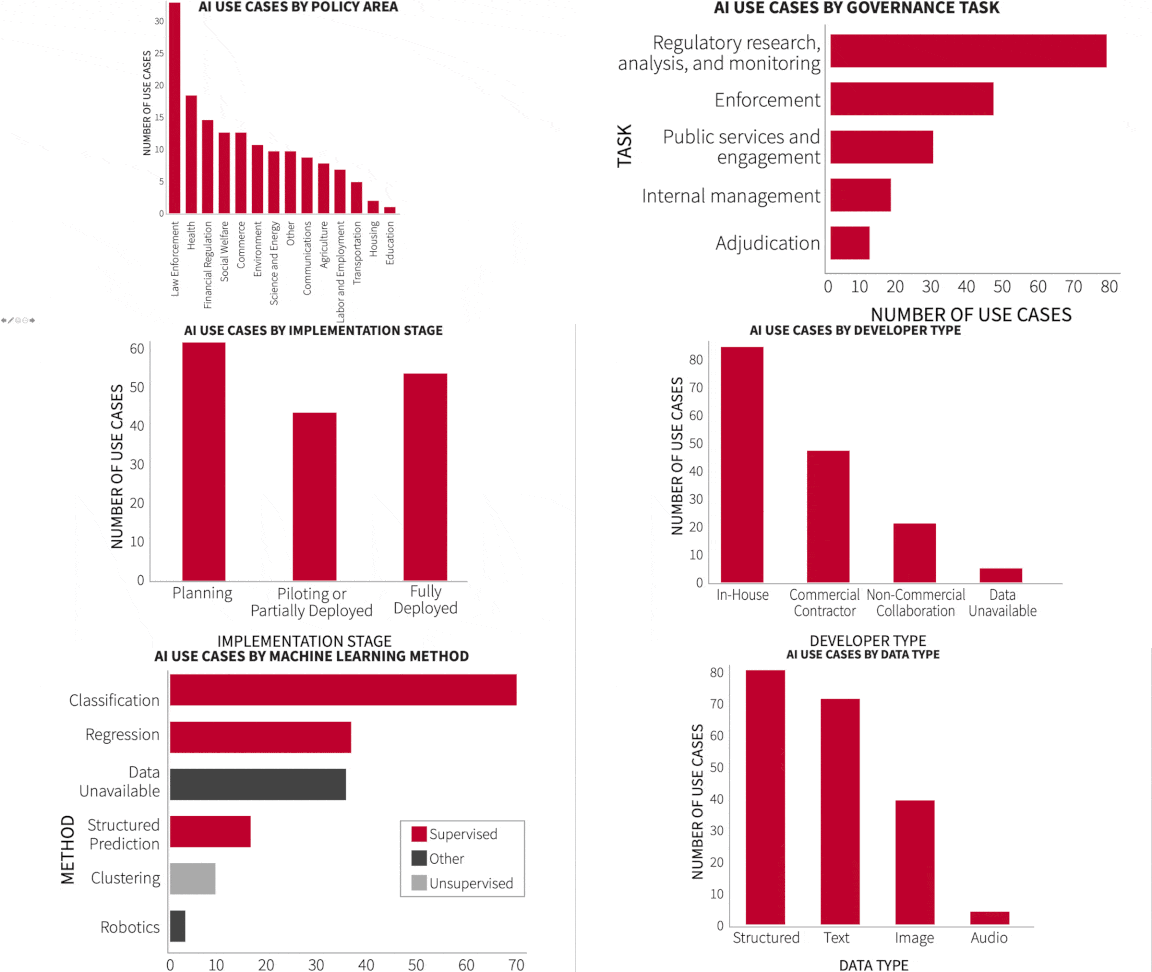
What they found: Less than half of civilian federal agencies surveyed used some form of AI, and about 7 percent of them accounted for the lion’s share of AI implementations evaluated. The most common implementations were in law enforcement, health care, and financial regulations. Examples include the Border Patrol’s use of face recognition for its Biometric Entry/Exit program and the Securities and Exchange Commission’s Corporate Issuer Risk Assessment, which helps regulators detect faults in companies’ financial reports.
- Only 12 percent of implementations used deep learning. The rest used approaches such as logistic regression with structured data (which the authors deemed lower sophistication) or random forests with hyperparameter tuning (which they judged medium sophistication).
- Government agencies are legally required to explain their decisions, such as why a person was denied benefits. But algorithms often reach conclusions for reasons that are not explainable, making it difficult to appeal.
- Around half of the systems evaluated were developed by outside contractors. The authors recommend greater investment in in-house talent because it’s more likely to tailor systems appropriately to government uses.
Yes, but: The authors relied primarily on publicly available information, which may not contain sufficient technical perspective for such analysis. In addition, the survey period ended in August 2019, so the report excludes systems deployed since then.
Why it matters: AI could help government agencies operate more effectively and efficiently, but this report shows that they have a long way to go to fulfill that vision.
We’re thinking: Governments have an obligation to audit AI systems for performance, fairness, and compliance before rolling them out. Yet most agencies (and, for that matter, most corporations) don’t have the capability to assess these factors. We need tools that that enable a variety of stakeholders to define clear standards and assess whether they’ve been met, so we can spot problems, mitigate risks, and build trust in automated systems. We hope that companies such as Credo AI (which is backed by Andrew Ng’s AI Fund) can help.
Better Crowd Counts
Did a million people attend the Million Man March? Estimates of the crowd size gathered at a given place and time can have significant political implications — and practical ones, too, as they can help public safety experts deploy resources for public health or crowd control. A new method improves on previous crowd-counting approaches with a novel way to compare predictions with hand-labeled training data.
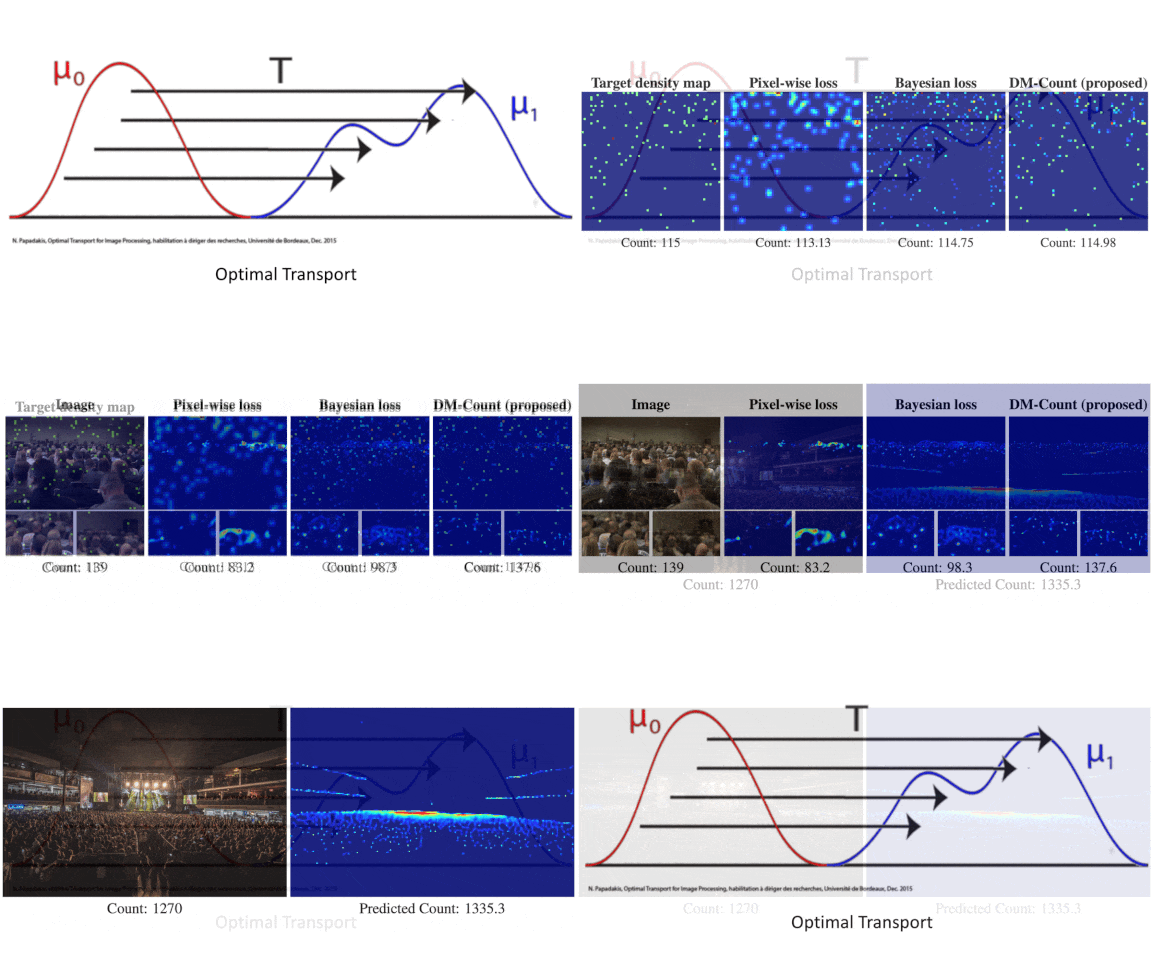
What’s new: DM-Count trains neural networks to count crowd size using optimal transport in the cost function. Optimal transport is a measure of difference between two distributions. In this case, the first distribution is the network’s prediction of people’s locations in a training example, and the second is the ground-truth locations. The method was developed by Boyu Wang and colleagues at Stony Brook University.
Key insight: Training datasets for crowd-counting models typically mark each person in an image with a single-pixel label. Training a network to match such labels is difficult, because tiny discrepancies in a label’s location count as errors. Previous approaches managed this problem by replacing the pixels with blobs, but choosing the right blob size is difficult given the wide range of sizes of people and parts of people in an image. Optimal transport gave the authors a way to compare the density of single-pixel predictions with that of single-pixel labels. Armed with this metric, they could measure the deformation necessary to match a matrix of predictions to the labels and apply a cost accordingly.
How it works: DM-Count accepts a picture of a crowd and places pixels where it sees people. Ideally, it would place one per person with 100 percent certainty, but in practice it spreads that certainty over a few pixels. In training, it learns to match those values to the training data using a loss function that combines three terms:
- Optimal transport loss helps the model learn to minimize differences between the distributions of predictions and labels. It’s computationally expensive to calculate, so DM-Count approximates it using the Sinkhorn algorithm.
- The Sinkhorn algorithm is less accurate in image areas that contain fewer people, so DM-Count applies an additional penalty based on the number of places in a predicted matrix that didn’t match the corresponding pixel-labels.
- A third loss term works to minimize the difference between the predicted and labeled counts.
Results: The authors built a modified [VGG-19]https://arxiv.org/abs/1409.1556 as detailed in this paper and used DM-Count to train it on datasets including NWPU, which the authors considered the most challenging crowd-counting dataset. Their method achieved a mean absolute error of 88.4 compared to 106.3 for Context-Aware Crowd Counting, the previous state of the art.
Yes, but : Context-Aware Crowd Counting achieved a marginally lower root mean squared error (386.5) than DM-Count’s (388.6).
Why it matters: We often try to improve models by finding better ways to format training data such as replacing pixels with blobs. This work shows that finding new ways to evaluate a network’s predictions can be a good alternative.
We’re thinking: Can this method be adapted to check whether people in a crowd are maintaining proper social distance?
A MESSAGE FROM DEEPLEARNING.AI
Courses 1 and 2 of the TensorFlow: Advanced Techniques Specialization are now available to learners on Coursera! Enroll now
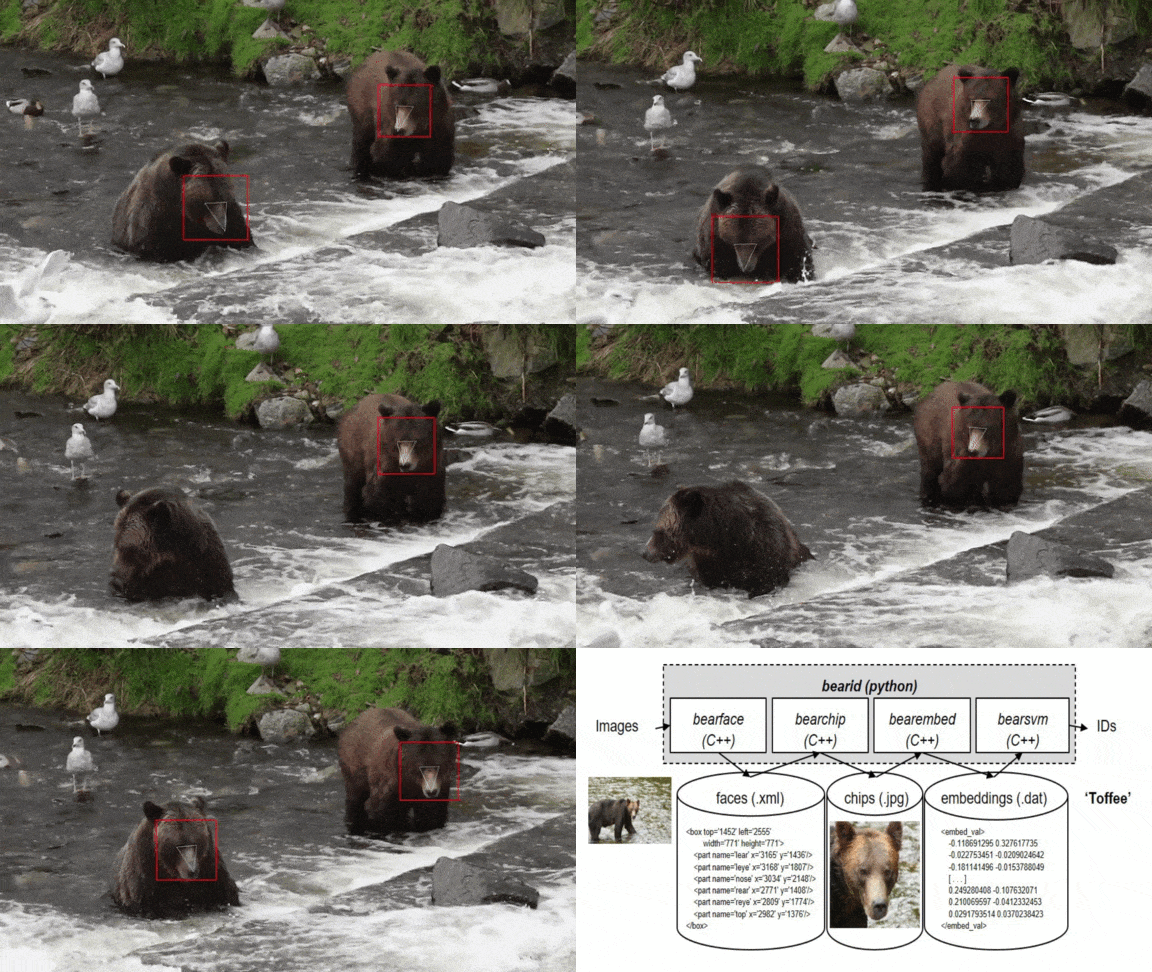
Caught Bearfaced
Many people worry that face recognition is intrusive, but wild animals seem to find it bearable.
What’s new: Melanie Clapham at University of Victoria with teammates of the BearID Project developed a model that performs face recognition for brown bears.
How it works: BearID recognizes individual bears with 84 percent accuracy. It comprises four components: bearface, bearchip, bearembed, and bearsvm.
- Bearface detects bear faces. It’s a variation on Dog Hipsterizer, an application that whimsically decorates pictures of pooches with eye glasses and mustaches, trained and tested on 4,675 photos of 132 bears.
- Bearchip reorients and crops the image.
- Bearembed generates a representation of the face. It’s a ResNet-34 adapted from the Dlib library. The authors trained it on cropped images from the training set to make features of the same bear similar and features of different bears dissimilar.
- Bearsvm, also adapted from Dlib, labels the representation as an individual. It’s a linear SVM trained using features generated by Bearembed and ID labels in the training set.
Behind the news: Face recognition systems have been built for a growing number of non-human species, including chimpanzees, lemurs, and pandas.
Why it matters: By providing a low-cost way to track individual animals, apps like BearID could help researchers and conservationists map habitats for protection and monitor the health of animal populations. Clapham has been experimenting with the model in the field, and the team hopes to pair it with camera traps, which would allow researchers to monitor large wild populations.
We’re thinking: We’re so impressed, we can bearly contain our appaws!

Very Short, Did Read
A new summarization model boils down AI research papers to a single sentence.
What’s new: TLDR from Allen Institute for AI creates at-a-glance summaries of scientific research papers. It’s up and running at Semantic Scholar, a research database, where searches now return its pithy precis.
How it works: The researchers trained BART, a pretrained language model, using a multitask learning strategy. Because the dataset of summaries was small, the authors also trained the model to generate titles, a task for which far more data was available.
- The researchers compiled SciTLDR, a dataset that comprises 5,411 one-sentence summaries of 3,229 papers. All papers are paired with at least one one-sentence summary written by the author of the paper. One-third of them also come with a one-sentence summary written by students based on peer-review comments.
- To this dataset, they added 20,000 scientific papers and their titles.
- They trained the model to generate either a summary or a title depending on a control code.
- To save on computation, TLDR analyzes only a paper’s abstract, intro, and conclusion.
Results: TLDR was able to summarize research articles that averaged 5,000 words long using around 20 words. Human experts ranked the output of TLDR, BART model trained only on SciTLDR, the author-generated summaries, and student-generated summaries of 51 papers chosen at random. TLDF outperformed BART trained on SciTLDR, achieving a mean reciprocal rank, where 1 is highest, of 0.54 versus 0.42. Its output ranked on par with the author generated summaries (0.53) but worse than the student generated summaries (0.60).
Behind the news: Most summarizers produce summaries that average between 150 and 200 words.
Why it matters: At least 3 million scientific papers are published annually, Semantic Scholar estimates, and a growing portion of them describe innovations in AI, according to the AI Index from Stanford Human-Centered Artificial Intelligence. This model, along with the excellent Arxiv Sanity Preserver, promises a measure of relief to weary engineers and students. (To learn more about the Allen Institute for AI’s research, watch our Heroes of NLP interview with AI2 CEO Oren Etzioni here.)
We’re thinking: Some papers can be summed up in a couple of dozen words, but many are so complex that no single sentence can do them justice. We look forward to n-sentence summarizers.