
Dear friends,
On Monday, the European Union fined Meta roughly $275 million for breaking its data privacy law. Even though Meta’s violation was not AI specific, the EU’s response is a reminder that we need to build AI systems that preserve user privacy — not just to avoid fines but because we owe it to the people who are represented in the data.
Many companies that would benefit from machine learning can’t afford to hire enough skilled engineers. This creates a need for cloud-based AI software as a service (SaaS). How can customers of such services keep data private while counting on another party to process the data? Consider an AI system that reads electronic health records to make predictions about the patients. Can a hospital use a SaaS provider to monitor the system’s performance without exposing sensitive data?
Recently I learned about a monitoring technique that manages to keep data secure. While visiting Seattle, I met with Alessya Visnjic and Maria Karaivanova, two of the founders of WhyLabs, which provides a SaaS platform that monitors machine learning applications. (Disclosure: WhyLabs is a portfolio company of AI Fund, which I lead.) They explained how they help customers monitor deployed systems for problems like data drift — changes in the distribution of data because, say, a new disease emerged or the hospital started collecting data in a new way — while maintaining data privacy. In their approach, data never leaves the customer’s system. Instead, the SaaS provider (i) computes statistics on data at the source using efficient techniques based on Apache DataSketches and (ii) analyzes the statistics.
The system enables customers to set up dashboards that track the distribution of input features (in this case, body temperature, red blood cell count, and so on) and alerts them when the distribution shows anomalies. Software that runs on the hospital’s server collects data from multiple patients and transmits only the aggregate statistics to the cloud. In this way, the system can look for anomalies without receiving any individual’s data.
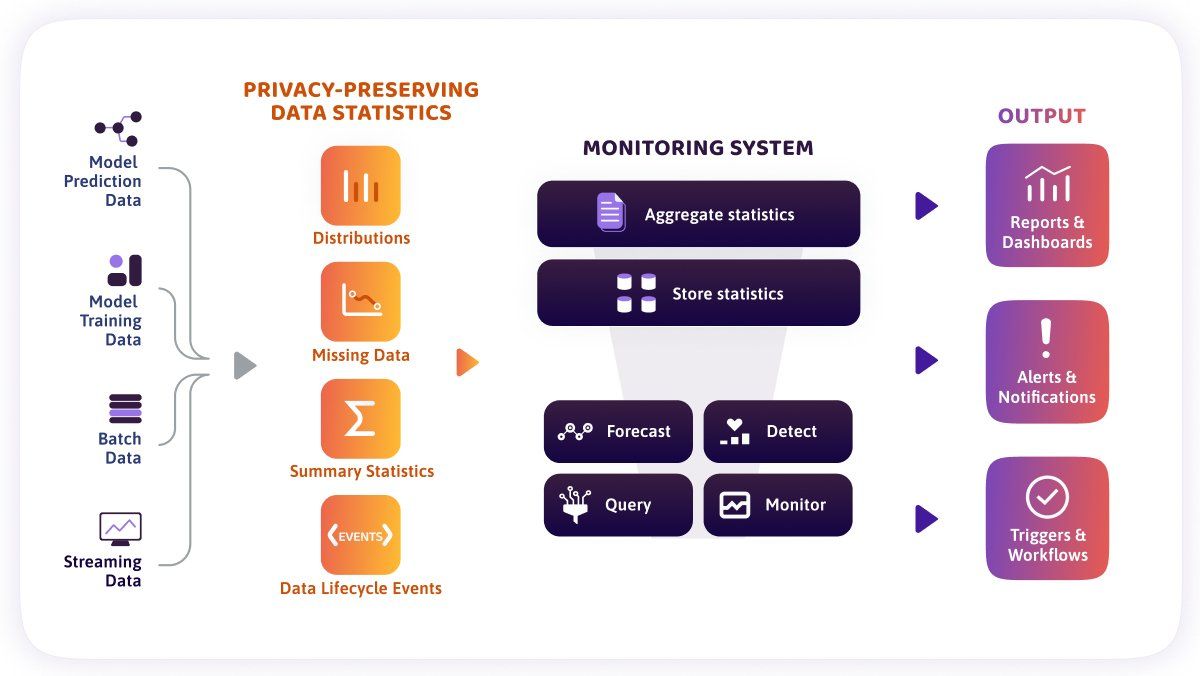
This is useful for detecting not only data drift but also data-quality problems. Let's say the hospital shifts to a more precise body temperature notation and leaves the old temperature field empty. The system would monitor the fraction of missing temperature values across all patients and alert the hospital that this field is frequently empty. This enables monitoring of critical data-quality markers such as:
- missing value ratio
- volume (that is, volume of data from different departments; a sudden drop in volume from one department may indicate a data pipeline issue in that department)
- cardinality (detecting new values added to a categorical data field)
- schema (which can catch changes in data types and formats, such as nine-digit postal codes entered into a field intended for five-digit postal codes)
In the data-centric approach to building a machine learning system, our job isn’t done when we deploy a model. We still need to watch out for and address post-deployment issues. Too many teams don’t continuously monitor their models after deploying them because they’re concerned about complexity or privacy. This leads to outdated models that may perform poorly for weeks or months before the problem is detected.
In some tasks, complete privacy may not be possible when working with a SaaS provider, but WhyLabs’ approach (which includes open source tools) preserves privacy while logging and monitoring. I hope we continue to invent techniques that enable AI systems to process data in the cloud while maximizing the degree of privacy we can offer to users and customers.
Keep learning!
Andrew
News
Translating a Mostly Oral Language
Most speech-to-speech translation systems use text as an intermediate mode. So how do you build an automated translator for a language that has no standard written form? A new approach trained neural networks to translate a primarily oral language.
What’s new: Peng-Jen Chen, Kevin Tran, Yilin Yang and teammates at Meta described a system that translates speech between English and Hokkien, which is spoken by millions of people in east Asia.
Key insight: Few people know how to translate between English and Hokkien, which makes it hard to assemble a dataset sufficient for training an English-Hokkien translation model. However, a fair number of people can translate between Mandarin and English and between Mandarin and Hokkien. By translating from English to Mandarin and from Mandarin to Hokkien, it’s possible to build a database of English-Hokkien speech pairs.
The dataset: The authors collected a corpus of English, Mandarin, and Hokkien data. They employed human translators to translate the corpus. They used the translated corpus to synthesize further data.
- The initial corpus comprised (a) videos of Hokkein dramas with subtitles (5.8 hours of which were manually translated from Mandarin text into English text and speech), (b) an existing dataset of Hokkien speech (manually translated into English text and 4.6 hours of English speech), and (c) an existing dataset of English-to-Mandarin speech and text (manually translated into 86 hours of Hokkien speech).
- To synthesize additional English-to-Hokkien speech pairs, the authors used an existing trained model to translate English text with matching speech into Mandarin text. Then, using the Hokkien dramas, they trained a text-to-speech transformer to translate Mandarin text to Hokkien speech. This process yielded 1,500 hours of corresponding English-Hokkien speech.
- They used a similar process to synthesize additional Hokkein-to-English speech pairs (starting with the Hokkien dramas). This process yielded 8,000 hours of corresponding Hokkien-to-English speech.
The translators: Separate speech-to-speech systems with identical architectures translate from Hokkien to English and English to Hokkien, using Mandarin text as a stepping stone between the target languages.
- Given English or Hokkien speech, HuBERT encoders and HiFi-GAN decoders learned to convert English and Hokkien speech to tokens and back.
- Given English or Hokkien speech, separate wav2vec 2.0 transformers learned to convert them into tokens.
- Given English or Hokkein tokens, separate mBART decoders learned to turn them into Mandarin or English text respectively.
- Given the resulting text, two transformer layers learned to translate it into Hokkien or English speech tokens.
- At inference, the HiFi-GAN decoder converts those tokens into speech.
Results: The authors compared their system to a baseline of their own design that translated directly between the spoken languages using an encoder-decoder. They evaluated the systems according to ASR-BLEU, which compares text overlap (higher is better) against reference text after translating speech to text. To render Hokkien speech as text for comparison, they developed a separate model that translated Hokkien speech into a phonetic script called Tâi-lô. Converting English to Hokkien, their system achieved 7.3 ASR-BLEU, whereas the baseline achieved 6 ASR-BLEU. Converting Hokkien to English, their system achieved 12.5 ASR-BLEU, whereas the baseline achieved 8.1 ASR-BLEU. Without the augmented data, both their system and the baseline scored worse by 6 ASR-BLEU to 9 ASR-BLEU.
Why it matters: Forty percent of the world’s languages have no standard written form, which means they’re left out of current translation systems. This method provides a blueprint for machine translation of other primarily oral languages.
Yes, but: Hokkien is spoken in several dialects, some of which are mutually unintelligible. So, while this system presumably serves most Hokkien speakers, it doesn’t serve all of them yet.
We’re thinking: The next step is to hook up the Hokkein-English model to existing translators for other languages. Is it good enough? ASR-BLEU scores in the 7-to-12 range are low compared to scores for, say, English-German, which are around 30. And, because translation errors compound from one language to the next, the more intermediate steps required to reach the target language, the lower the final translation quality. One way or another, we want to hear Hokkien speakers talking to everyone!

Billboards Are Watching
AI-driven signs are deciding what to display based on data harvested from passersby.
What’s new: Companies that sell advertising in public spaces use face analysis and personal data to match ads with potential viewers in real time, civil-liberties watchdog Big Brother UK detailed in a new report.
How it works: The report compiles applications and case studies drawn from product summaries and blog posts published by ad-tech companies.
- Quividi, a French maker of smart signs, offers a system that analyzes up to 100 faces at a time, identifying their gender, age, and mood along with the direction they’re facing and how long they look at the screen. UK advertising company Ocean Outdoor uses Quividi’s technology in shopping malls and commercial districts in five UK cities. One of its ads promoted Emoji Movie by showing passersby with their faces overlaid by emojis. Another that was intended to raise awareness of suicide risk depicted a girl with a sad expression who smiled when people looked at the ad.
- Digital displays built by Florida-based Alfi include smart cameras that estimate the age and gender of nearby people. (They can also detect race or ethnicity, although the company says it doesn’t currently use this capability.) The company combines this information with data such as weather and time to select which ads to display. At least two UK shopping malls use Alfi systems, and taxis and ride-share vehicles in the UK and U.S. use them to control back-of-headrest screens.
- ClearChannel, based in Texas, analyzes faces via 3,000 electronic billboards and 1,200 bus-stop signs in the UK. Many of its signs integrate technology from the German company Adsquare, which classifies groups such as “fast-food enthusiasts,” and “interested in organic and eco-conscious” food based on cell phone user data that details their locations, demographics, and interests. The system alters which ads it shows depending on which groups are passing by.
Behind the news: These companies walk a tightrope over local privacy protections. Adsquare, Alfi, and Quividi tout their compliance with Europe’s General Data Protection Regulation (GDPR), which protects privacy in member countries. Last year, U.S. lawmakers sent letters of concern to Lyft and Uber after some drivers independently put Alfi-equipped advertising screens in their vehicles. Both ride-share companies responded that equipment installed by drivers was beyond their control.
Why it matters: The combination of electronic signage, computer vision, and cloud computing brings to the real world practices that are common in advertising on the internet.
We’re thinking: Online advertising has flourished as increased personalization allowed more precise targeting. Public advertising is poised to do the same.
A MESSAGE FROM FILTERED

What do you think about coding tests and technical interviews? We’d like to hear the good, the bad, and the ugly. Tell us about your technical interview experiences and earn a chance to win a $100 gift card! Take the survey
Algorithms Control the Capital
A new report offers a rare peek into the use of automated decision-making tools by the government of a major city.
What’s new: Municipal agencies in the U.S. capital of Washington, D.C., use at least 29 algorithms to streamline their operations, according to a study by the Electronic Privacy Information Center. The authors found references to the models in public records and internal documents. In many cases, their roles were not widely known.
How it works: The algorithms span a variety of municipal functions.
- Criminal justice: The Department of Youth and Rehabilitative Services developed a model that estimates a juvenile offender’s likelihood of committing new crimes using data such as school attendance and prior court cases. The police department uses systems including ShotSpotter to locate the source of gunfire and TrapWire to find patterns in reports of suspicious behavior.
- Economic opportunity: The Department of Human Services and Department of Employment Services score recipients of welfare and unemployment insurance on their risk of committing fraud via FraudCaster and Case Tracker.
- Education: The University of the District of Columbia identifies students at risk of failing to graduate using a tool created by the Education Advisory Board, a for-profit consultancy.
- Health: The city’s Office of Veterans Affairs developed a model that scores the risk of death for Covid-19 patients.
- Housing: The city’s Department of Buildings scores a building’s risk of code violations, based on data such as the building’s age and prior history of code violations, via an algorithm developed by Georgetown University.
Behind the news: Washington, D.C. lawmakers are considering a law that would require regular audits of decision-making algorithms used by organizations of a particular size and those that hold data on city residents. It would also enable the Office of the Attorney General and others to sue for violations.
Yes, but: While the authors discovered many automated decision-making systems in use, many more may be hidden from view. Several city agencies didn’t respond to requests for public records citing confidentiality and trade-secret agreements with vendors. New York City police were found to be using more algorithms than those the department had disclosed to officials as required by a 2020 law, Wired reported. Public registries in Amsterdam and Helsinki list only 10 out of 30 algorithms that have been disclosed in separate documents.
Why it matters: AI is reaching into a wide variety of government functions that have a direct and substantial impact on citizens’ lives. While the technology can help officials make decisions that are more efficient and sometimes more fair, their constituents need to know how their government operates and have a right to hold algorithms (and the officials who employ them) accountable for their decisions. Governments should supply this information as a matter of course, rather than forcing independent researchers to discover it.
We’re thinking: The term “smart city” shouldn’t just describe the algorithms used to govern the municipality. It should also describe a population that’s informed about how they’re being used.

Novel Views of 3D Scenes — Pronto
Given a number of images of the same scene, a neural network can synthesize images from novel vantage points, but it can take hours to train. A new approach cuts training time to a few minutes.
What’s new: Thomas Müller and colleagues at Nvidia introduced a new method for learning representations of positions in a 3D scene. It’s compatible with Neural Radiance Fields (NeRF), a popular way to synthesize images of a scene from novel perspectives.
NeRF basics: For a given scene, NeRF learns to reproduce ground-truth images shot by a camera from different positions and angles. At inference, given a camera position and angle, it generates views of a scene by sampling points along virtual light rays that extend from the camera through each pixel. Given an embedding of a point’s position and the ray’s direction, separate fully connected networks compute its color and transparency. (Typically many points occupy empty space, so they’re fully transparent and have no color.) The system combines the color and transparency of points along the ray to find the associated pixel’s color.
Key insight: Previous efforts to speed up NeRF training impose a 3D grid over the scene and learn an embedding of each grid point. When it comes to sampling coordinates along rays, these approaches interpolate embeddings of positions that fall in between the grid points. This process requires a lot of memory, and rendering is slow because ferrying data to the processor and back takes a lot of time. Limiting the total number of embeddings to fit within a processor’s cache eliminates this bottleneck, accelerating rendering. One way to do this is to hash the coordinates, which defines a function that maps them to the index of a list (hash table) of limited size. This makes it possible to map any number of points to a limited number of embeddings.
How it works: The authors trained separate systems of vanilla neural networks to generate 20 synthetic and real scenes used in the original NeRF paper. As in the original NeRF and its variants, the networks learned by minimizing the difference between the ground truth images and generated images from the same viewpoints. Given a camera position and viewing angle, the system projected a ray for each pixel in the resulting image and sampled from 3 to 26 points, depending on the scene’s size, along each ray.
- The system defined 16 3D grids with resolutions from coarse (16x16x16) to fine (512x512x512).
- Given a point along a ray at a particular resolution, it located the positions of the eight corners of the cell closest to it and hashed the coordinates to retrieve the corresponding embeddings. Then it interpolated the embeddings to calculate a vector that represented the point.
- It repeated this process at each resolution, producing 16 separate hash tables. Hashing each point’s coordinates at multiple resolutions kept the points differentiated by making it unlikely that different points would map to the same embedding (a phenomenon known as a hash collision) at all resolutions.
- The system concatenated each point’s embeddings at every resolution and fed them to two vanilla neural networks. One network estimated opacity and the other estimated color.
Results: The authors evaluated the system using Peak Signal-to-Noise Ratio (PSNR), which measures image reconstruction quality (higher is better), and compared their results to the original NeRF and similar Mip-NeRF. Averaged across all scenes, the new approach achieved 31.407 PSNR after 15 seconds of training (in contrast, NeRF achieved 31.005 PSNR after more than 12 hours of training) and 33.176 PSNR after five minutes of training (better than mip-NERF’s 33.090 PSNR after two to three hours of training).
Yes, but: Hash collisions, while rare, can still happen. The result is a rough surface texture.
Why it matters: Tailoring neural networks to hardware resources can accelerate processing with very little impact on output quality. This can dramatically reduce the time and money required to tackle modern machine learning tasks.
We’re thinking: The authors used a hash table to reduce the number of embeddings and dramatically accelerate rendering. Would the same method accelerate other models that rely on large numbers of embeddings?